InfluxDB plugin
InfluxDB
InfluxDB is a time-series database, ideal for storing and analyzing IoT sensor data.
InfluxDB can be used as a Cloud Service or installed on premise, even in reasonable constrained devices like Gateways and SBCs (i.e. RaspberryPi). A very interesting feature of InfluxDB is their integrated WebGUI, which can be used to analyze and visualize the sensor data stored in the DB.
The capture below shows an example of a dashboard showing data from a "uThing::VOC" and a "uThing::MNL" over a period of 2 days:
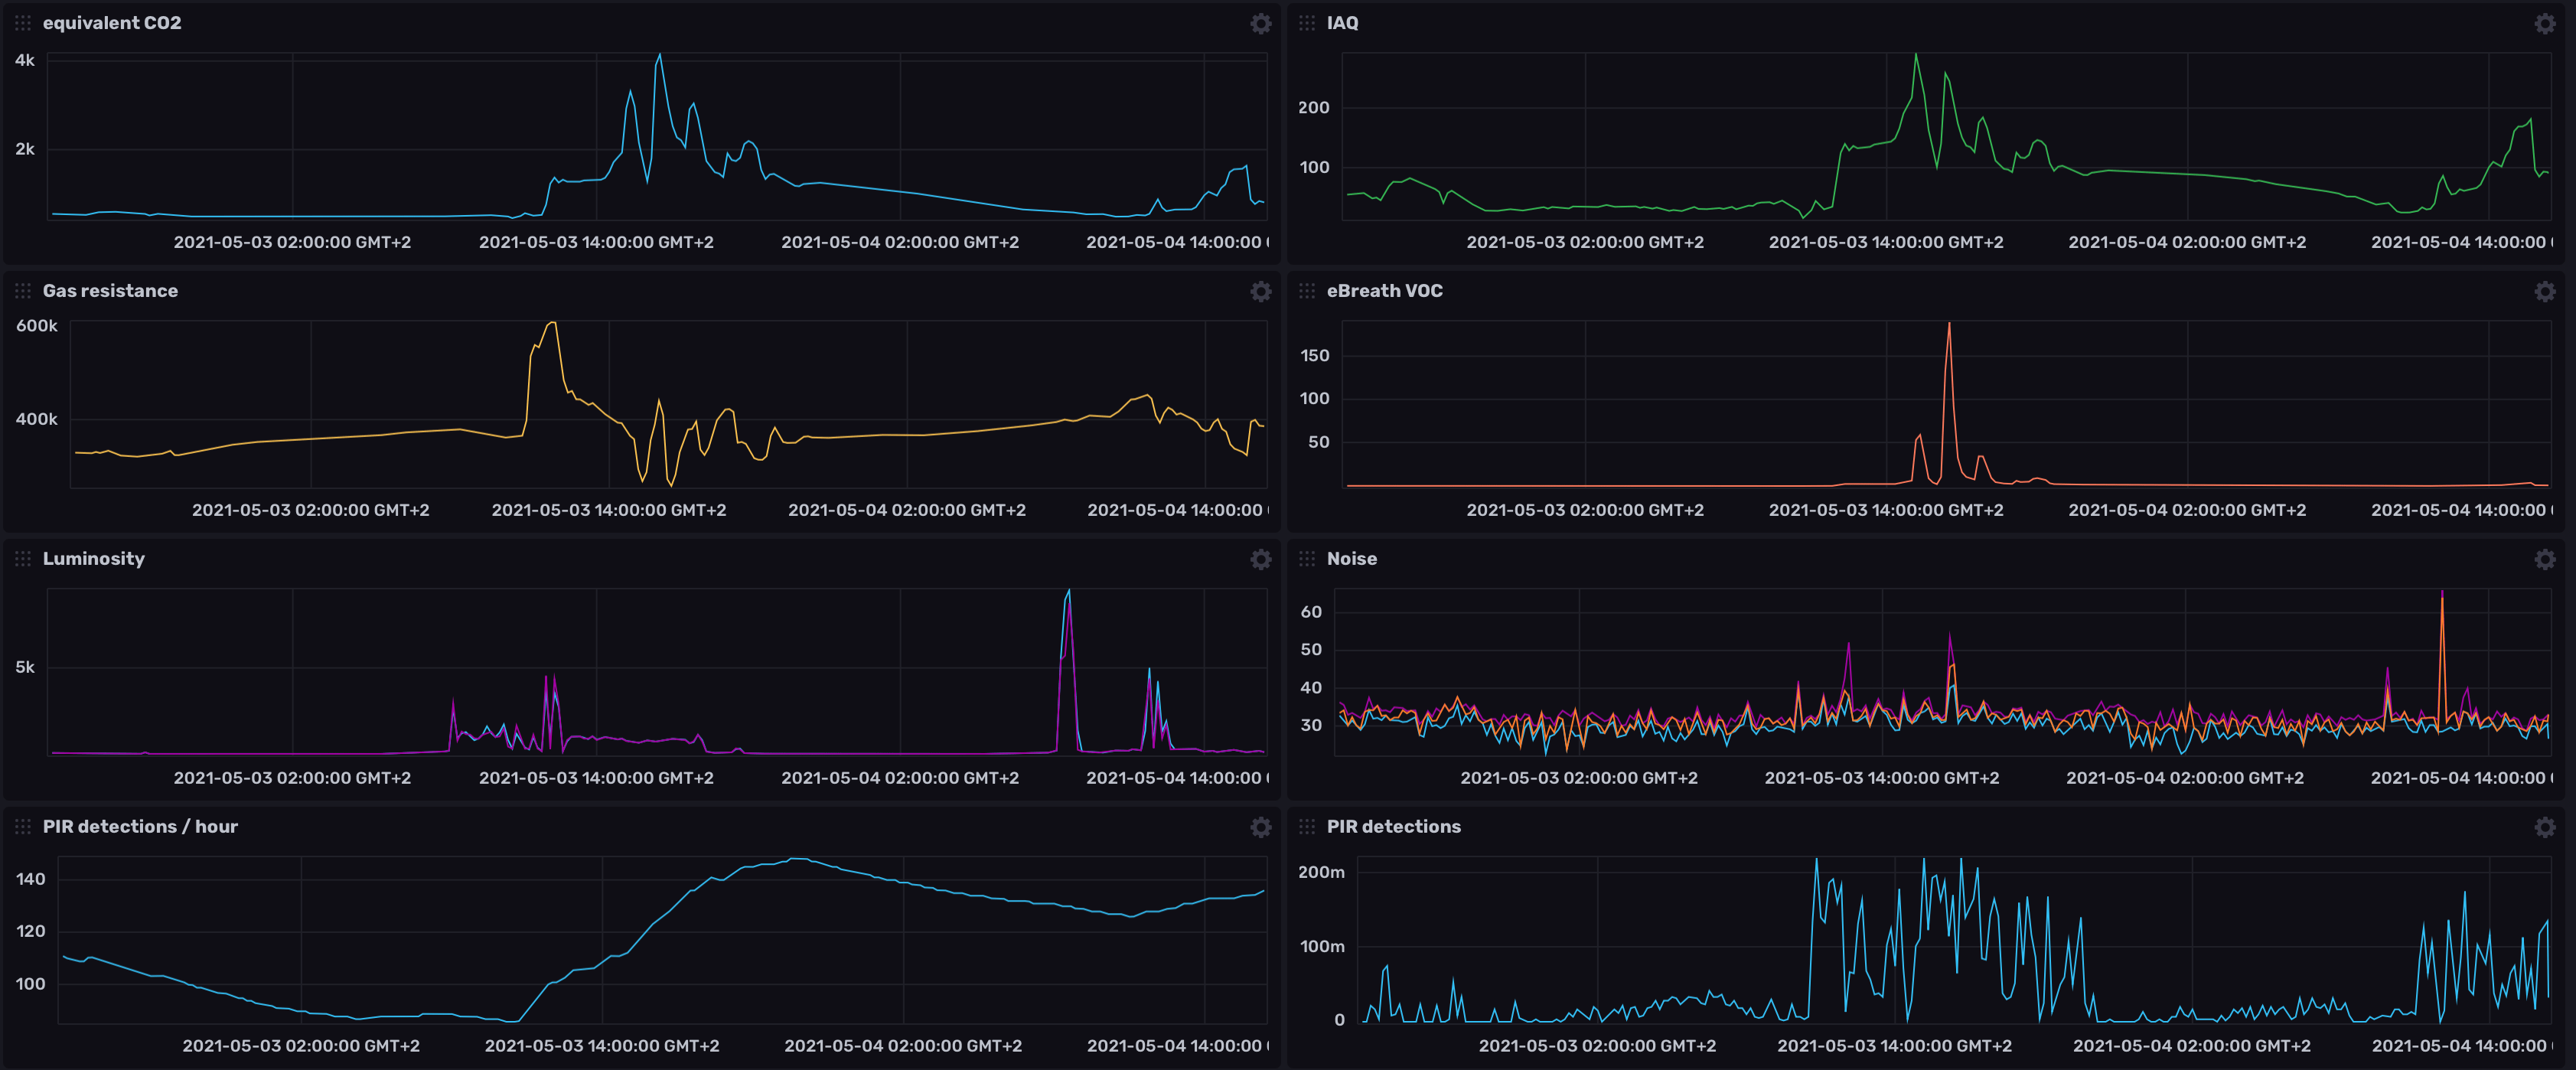
This plugin connects to the uBrigde server, subscribes for all the available sensor's data, and publishes the incoming data into an InfluxDB bucket. The sensor name ("channelID") is automatically added and the datapoints from this device stored under this measurement.
Source code and Installation
Using with the InfluxDB plugin in a RaspberryPi
At the moment of writing, InfluxDB 2.0 hasn't been released for the armhf port yet, so check the instructions below for help installing the arm64 Raspbian version before starting.
The source code and installation instructions can be found here.
Installing InfluxDB
The plugin has been tested with Influx v2.0.4-6 versions in a AMD64 based Ubuntu machine and in RaspberryPi-3 and 4.
The InfluxDB application can be downloaded here. Care must be taken on the selection of the proper distribution for your system (x86 or ARM, 32 or 64 bits).
If the goal is to install it into a RaspberryPi SBC, at the moment of writing (May 2021), Influx hasn't released a 32-bit version for the ARM architecture. So we need to use the "Linux Binaries (ARM 64-bit)", and install it into a 64-bit Linux on the RPi (the default Raspbian distribution at the moment is an armhf port).
Installing a 64-bit Linux on the RaspberriPi 3-4
(NOTE: this step won't be necesary if InfluxDB makes available the ARM 32-bit version)
There are a few alternatives:
-
One option is to use the ARM64 version of Raspberrian, available here. At the moment of writing, this is still in Beta phase, but we haven't encountered any issue with the uBridge and InfluxDB running on it.
-
Another option is to use the Ubuntu Server for RaspberriPi.
In order to install it into the RaspberriPi, just download the image and use your prefered method to burn it into the uSD card. We recommend Balena Etcher.
Configuring InfluxDB
If InfluxDB was sucessfully installed, the webapp should be available from a browser (i.e. http://raspberrypi.local:8086)
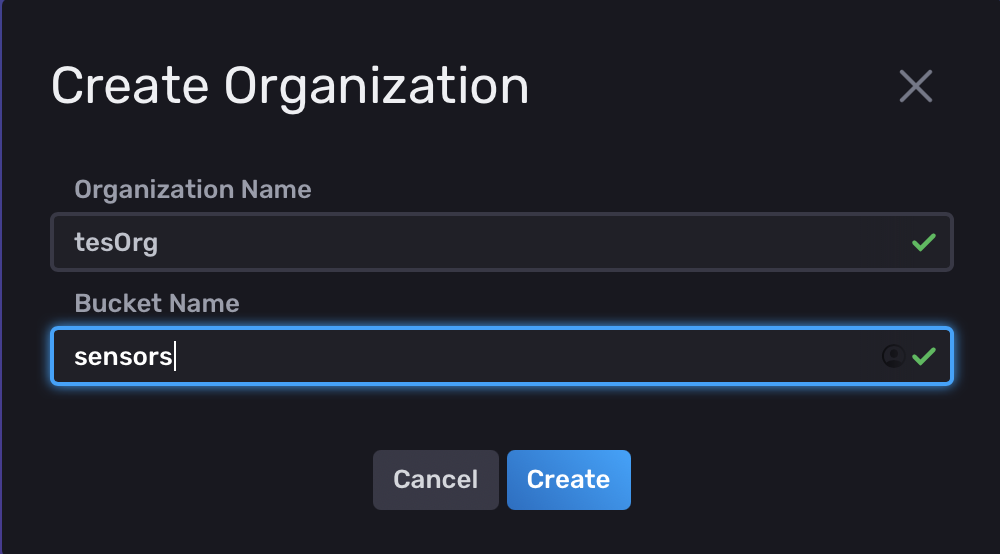
Once that your new user is created (be sure to store the password you provided), an "Organization" needs to be created, and this name needs to be used on the plugin config file, here you can also define the "bucket" name:
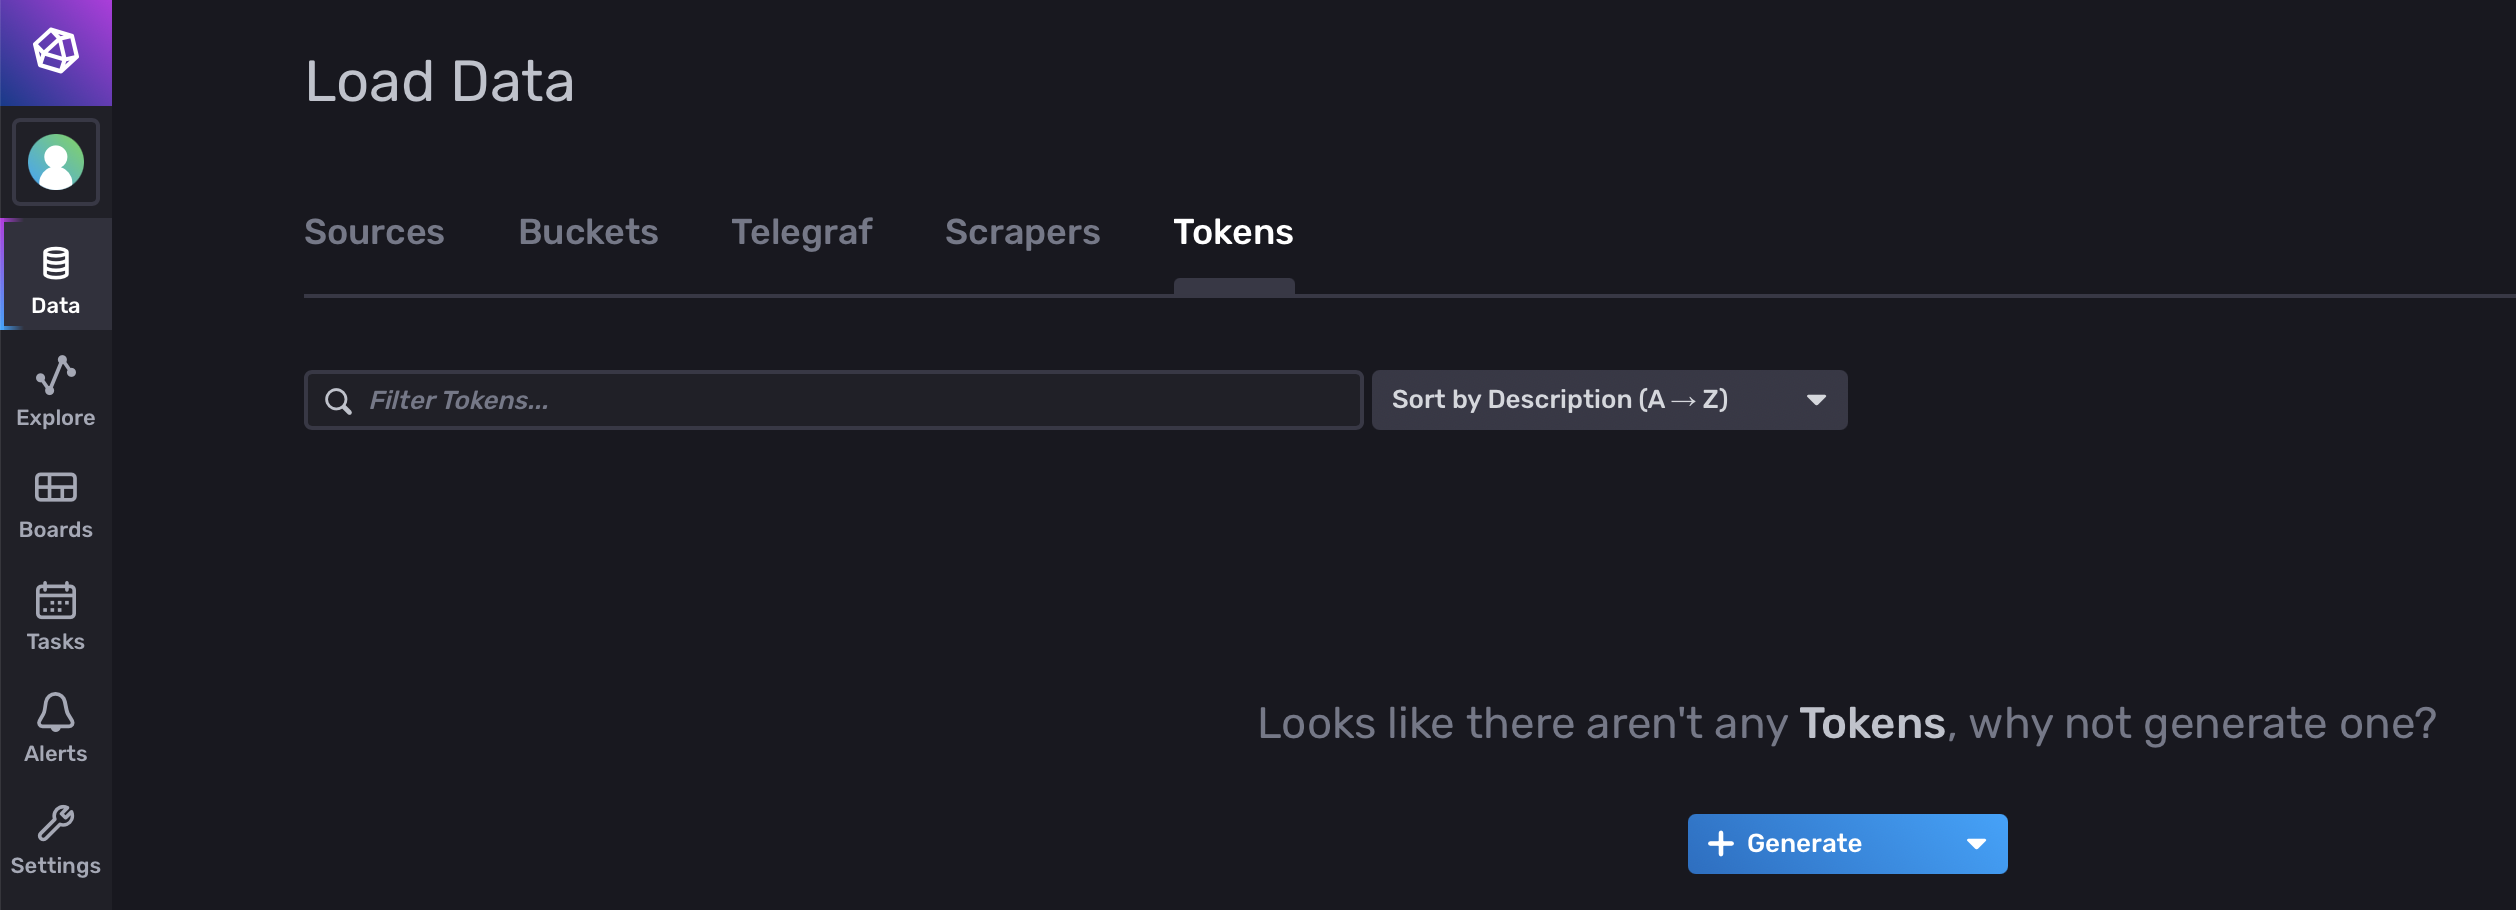
Now, over the "Data" icon, go to the "Tokens" tab and generate a new token:
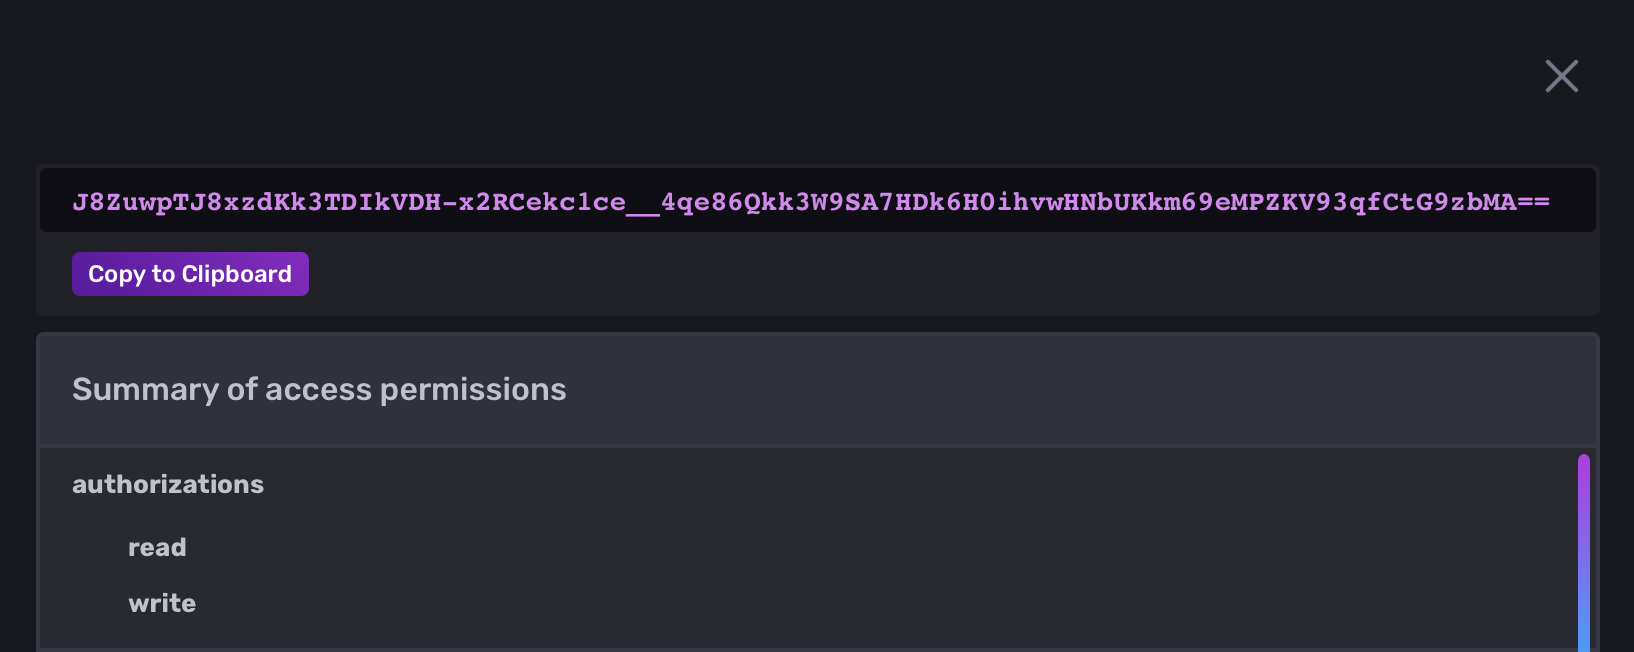
Once the token is created, copy and paste it into the plugin config file (see below)
Configuration file
The configuration file is installed here: /etc/ubridge/influx-plugin-config.json
Here is the default configuration:
{
    "ubridge": /* socket configuration for the uBridge side: */
    {
        "configSockUrl" : "ipc:///tmp/ubridgeReqResp",/* The sockets for the Request Response Server and data Streamer*/
        "streamSockUrl" : "ipc:///tmp/ubridgeStream"/* If the client app runs in the same machine, IPC is
                        more efficient. If a different host is used (as with a client running in a Docker instance)
                        use TCP host:port ("tcp://localhost:8001")*/
    },
    "influx":  /* configuration for the InfluxDB side: */
    {
        "url" : "http://localhost:8086",/*url:port (http default: localhost:8086)*/
        "bucket" : "sensors",/*name of the bucket (database) */
        "token" : "hHyrHUzvi6NzcWeofzly2CCwmWOEY95uK5ZIAj3wrlq8ndcMYPo1M8eOHaqzIramO11gwK9jdXJoDHLlFXci8g==",/*Data->Tokens tab on the Influx webapp */
        "org" : "dev"/*name of the org */
    }
}
- "configSockUrl and streamSockUrl": These have to be the same as in the uBridge configuration.
- "url": The url and port of the InfludDB instance.
- "bucket": The "bucket" name created from the InfluxDB GUI.
- "token": When a user is created, the GUI provides this "token" needed for the connection. It can be found in the "Data -> Tokens" tab.
- "org": The "org" name given during the user registration.
NOTE: Remember to restart the service after changing the configuration file (sudo systemctl restart ubridge-influx-plugin.service).
Building a dashboard
If everything went well (InfluxDB sucessfully installed and configured, ubridge and plugin services running), when a "uThing" device is plugged into the USB port, the data should start flowing and stored in the configured DB and bucket.
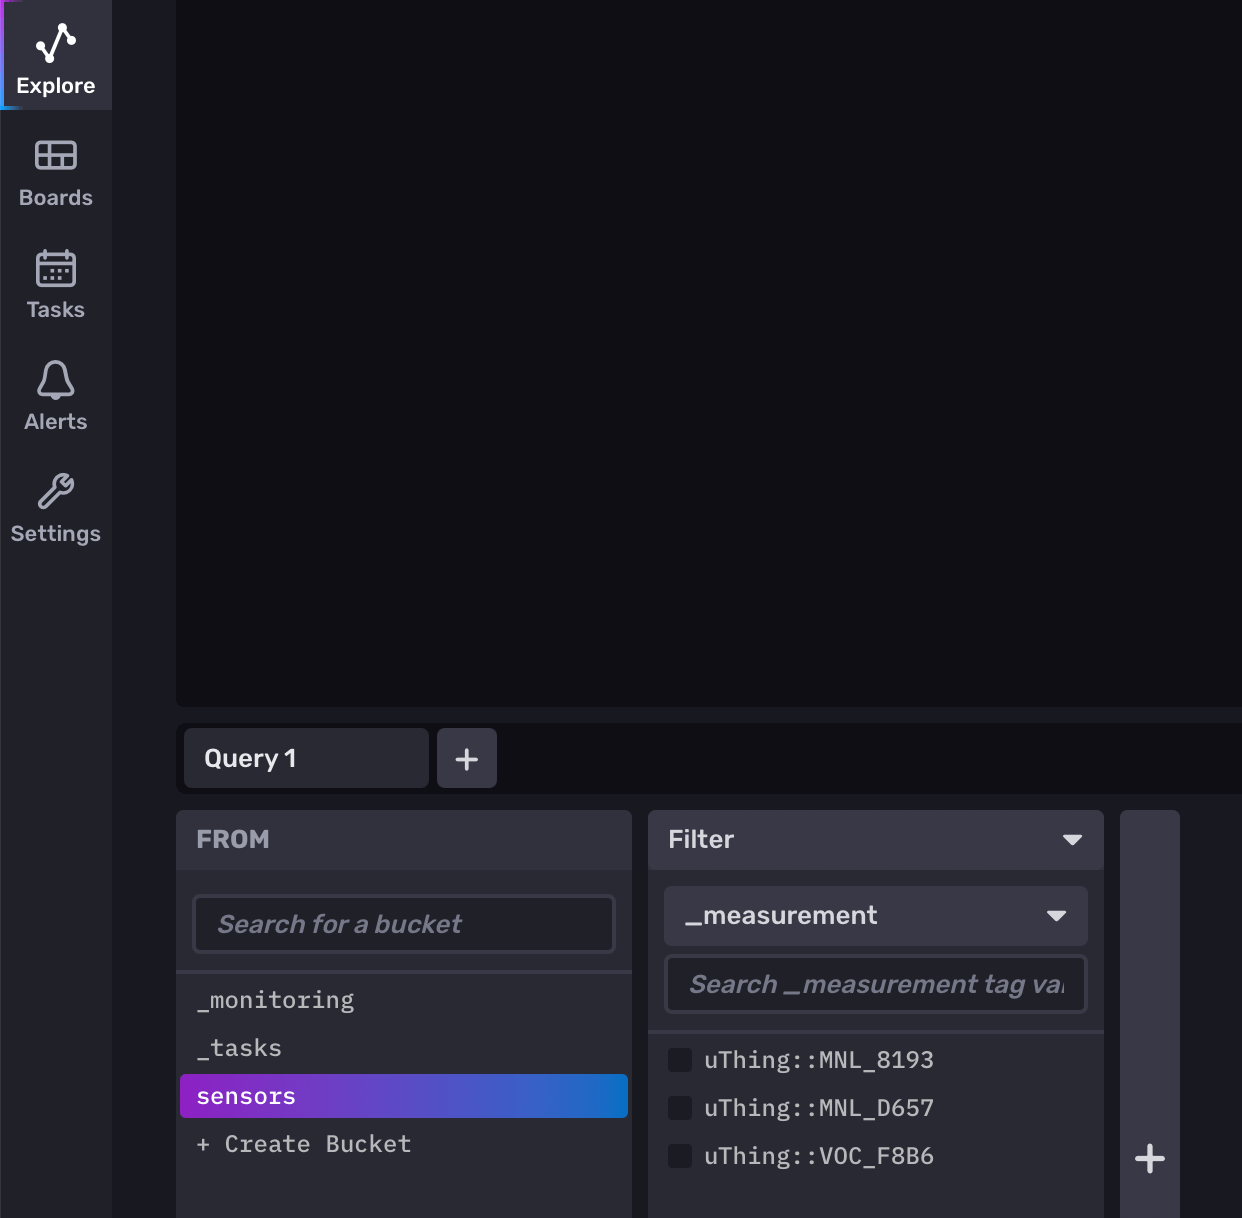
If we go to the "Explore" section, we should be able to see already data from the connected sensors under the configured bucket (i.e. "sensors")
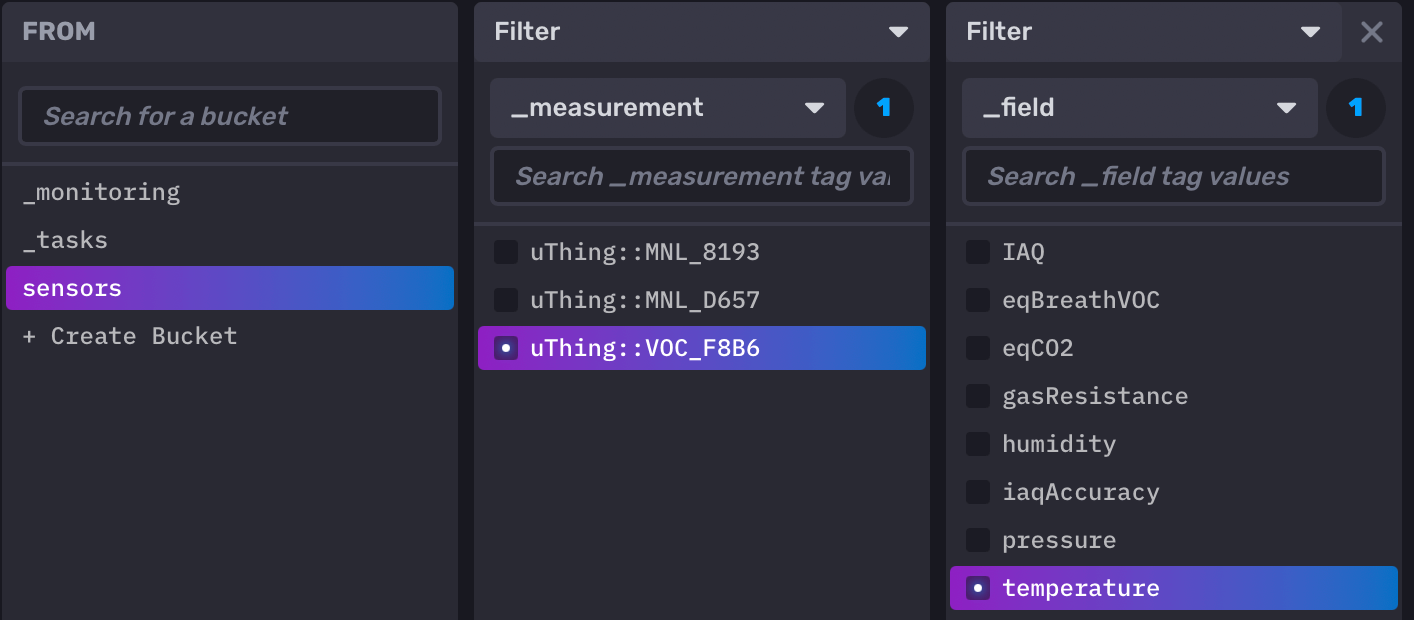
Now we can create a query, the interface is very intuitive. We can combine different sensors in the same plot, and even apply some basic data analytics by configuring a "custom" aggregate function on the bottom-right side (for instance, in some cases the "last" value could be interesting instead of the default mean calculation, or we can use it to calculate the standard deviation of the incoming data).
Plot information of the axis and colors can be changed by clicking on the "Customize" button.
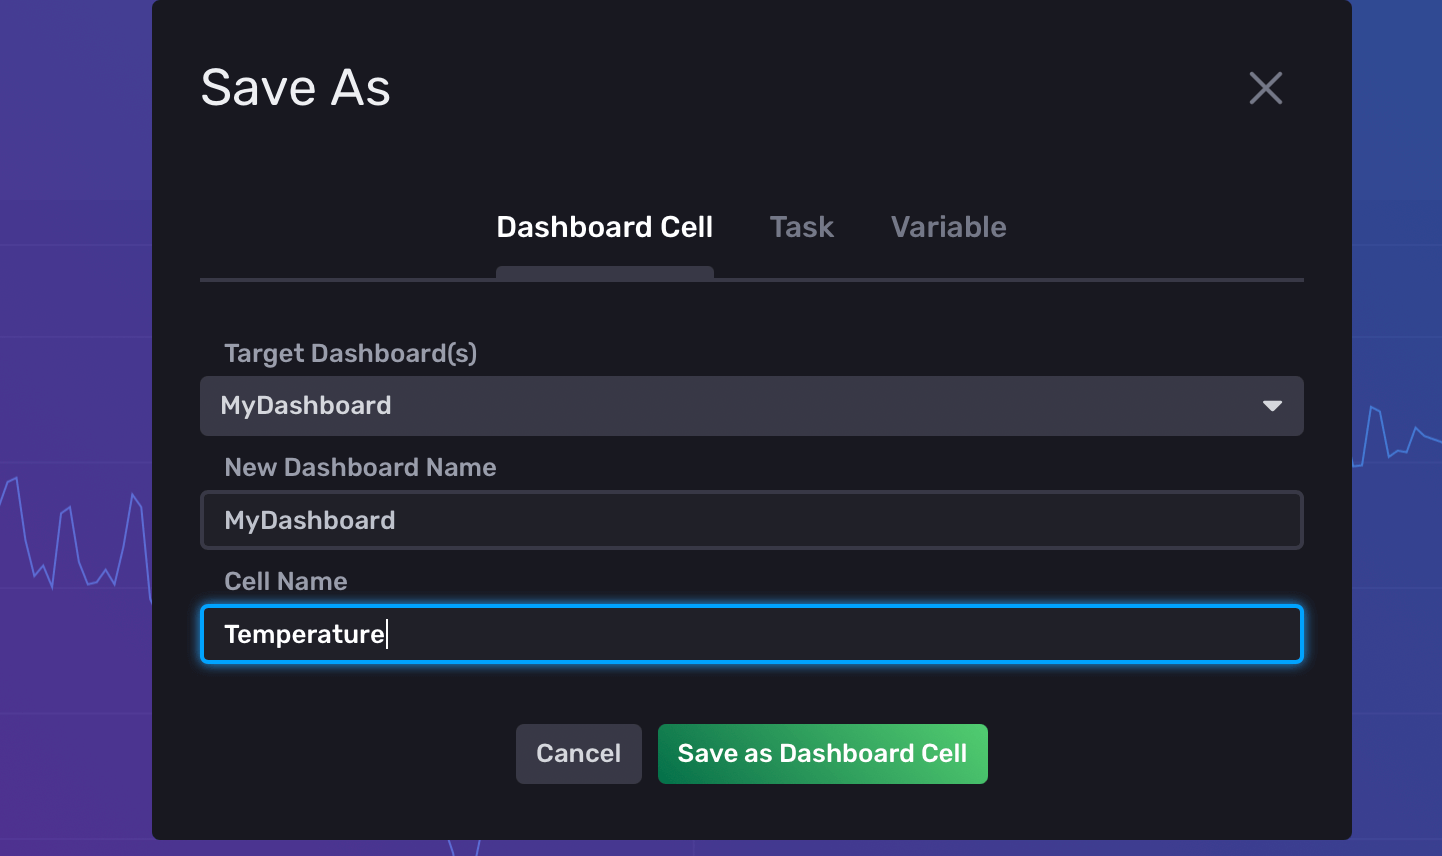
Once that we are happy with the query and plot configuration, we can send it to a dashboard with the "Save As" button. The cell name can be defined there or later on the dashboard.
Once that we have added the plots of interest, the dashboard can be easily tweaked (dashboards are under the "Boards" section)
Troubleshooting
InfluxDB needs to be properly installed and configured before the plugin service starts. So check that the configuration provided in the influx-plugin-config.json file matches the configuration on the InfluxDB GUI.
You can check the log file for more details:
tail /tmp/ubridge-influx.log
After modifying the configuration file, remember to restart the service.
Monitoring
Check running status of the service
systemctl status ubridge-influx-plugin.service
Log file
The log files for the uBridge and plugins are located in the /tmp directory:
tail /tmp/ubridge-influx.log